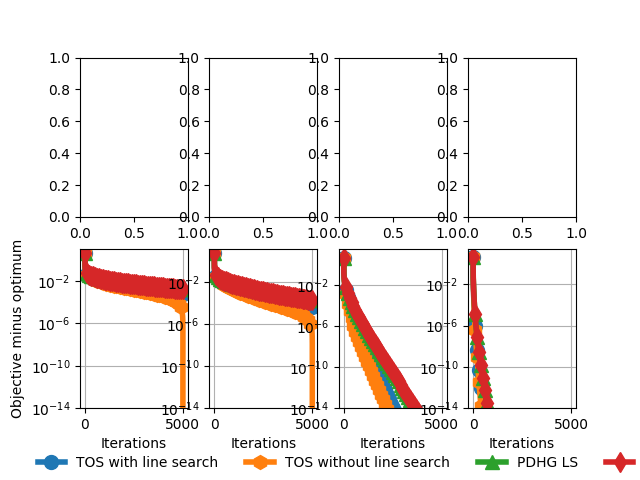
Group lasso with overlap
Comparison of solvers for a least squares with overlapping group lasso regularization.
Out:
0.401250471401398
beta = 0
beta = 0.001
beta = 0.01
Achieved relative tolerance at iteration 4850
beta = 0.1
Achieved relative tolerance at iteration 675
Achieved relative tolerance at iteration 531
import numpy as np
from scipy.sparse import linalg as splinalg
from sklearn import datasets
import pylab as plt
import copt as cp

np.random.seed(0)

# .. generate some data ..

n_samples, n_features = 100, 100
groups = [np.arange(8 * i, 8 * i + 10) for i in range(n_features // 8)]


ground_truth = np.zeros(n_features)
ground_truth[groups[4]] = 1
ground_truth[groups[5]] = 0.5


A = np.random.randn(n_samples, n_features)
p = 0.5
for i in range(1, n_features):
    A[:, i] = p * A[:, i] + (1 - p) * A[:, i-1]
A[:, 0] /= np.sqrt(1 - p ** 2)
sigma = 1.
b = A.dot(ground_truth) + sigma * np.random.randn(n_samples)


# .. compute the step-size ..
max_iter = 5000
s = splinalg.svds(A, k=1, return_singular_vectors=False)[0]
step_size = 1. / cp.utils.get_lipschitz(A, 'square')
print(step_size)
f = cp.utils.SquareLoss(A, b)

# .. run the solver for different values ..
# .. of the regularization parameter beta ..
all_betas = [0, 1e-3, 1e-2, 1e-1]
all_trace_ls, all_trace_nols, all_trace_pdhg_nols, all_trace_pdhg = [], [], [], []
all_trace_ls_time, all_trace_nols_time, all_trace_pdhg_nols_time, all_trace_pdhg_time = [], [], [], []
out_img = []
for i, beta in enumerate(all_betas):
    print('beta = %s' % beta)
    groups1, groups2 = groups[::2], groups[1::2].copy()
    G1 = cp.utils.GroupL1(beta, groups1)
    G2 = cp.utils.GroupL1(beta, groups2)

    def loss(x):
        return f(x) + G1(x) + G2(x)

    cb_tosls = cp.utils.Trace()
    x0 = np.zeros(n_features)
    cb_tosls(x0)
    tos_ls = cp.minimize_TOS(
        f.func_grad, x0, G1.prox, G2.prox, step_size=3 * step_size,
        max_iter=max_iter, tol=1e-14, verbose=1,
        callback=cb_tosls)
    trace_ls = np.array([loss(x) for x in cb_tosls.trace_x])
    all_trace_ls.append(trace_ls)
    all_trace_ls_time.append(cb_tosls.trace_time)

    cb_tos = cp.utils.Trace()
    x0 = np.zeros(n_features)
    cb_tos(x0)
    tos = cp.minimize_TOS(
        f.func_grad, x0, G1.prox, G2.prox,
        step_size=step_size,
        max_iter=max_iter, tol=1e-14, verbose=1,
        line_search=True, callback=cb_tos, h_Lipschitz=beta)
    trace_nols = np.array([loss(x) for x in cb_tos.trace_x])
    all_trace_nols.append(trace_nols)
    all_trace_nols_time.append(cb_tos.trace_time)
    out_img.append(tos.x)

    cb_pdhg = cp.utils.Trace()
    x0 = np.zeros(n_features)
    cb_pdhg(x0)
    pdhg = cp.gradient.minimize_PDHG(
        f.func_grad, x0, G1.prox, G2.prox,
        callback=cb_pdhg, max_iter=max_iter,
        step_size=step_size,
        step_size2=(1. / step_size) / 2, tol=0, line_search=False)
    trace_pdhg = np.array([loss(x) for x in cb_pdhg.trace_x])
    all_trace_pdhg.append(trace_pdhg)
    all_trace_pdhg_time.append(cb_pdhg.trace_time)

    cb_pdhg_nols = cp.utils.Trace()
    x0 = np.zeros(n_features)
    cb_pdhg_nols(x0)
    pdhg_nols = cp.gradient.minimize_PDHG(
        f.func_grad, x0, G1.prox, G2.prox,
        callback=cb_pdhg_nols, max_iter=max_iter,
        step_size=step_size,
        step_size2=(1. / step_size) / 2, tol=0, line_search=False)
    trace_pdhg_nols = np.array([loss(x) for x in cb_pdhg_nols.trace_x])
    all_trace_pdhg_nols.append(trace_pdhg_nols)
    all_trace_pdhg_nols_time.append(cb_pdhg_nols.trace_time)
    #

# .. plot the results ..
fig, ax = plt.subplots(2, 4, sharey=False)
xlim = [0.02, 0.02, 0.1]
for i, beta in enumerate(all_betas):
    # ax[0, i].set_title(r'$\lambda=%s$' % beta)
    # ax[0, i].set_title(r'$\lambda=%s$' % beta)
    # ax[0, i].plot(out_img[i])
    # ax[0, i].plot(ground_truth)
    # ax[0, i].set_xticks(())
    # ax[0, i].set_yticks(())

    fmin = min(np.min(all_trace_ls[i]), np.min(all_trace_nols[i]))
    scale = 1. # all_trace_ls[i][0] - fmin
    plot_tos, = ax[1, i].plot(
        (all_trace_ls[i] - fmin) / scale,
        lw=4, marker='o', markevery=100,
        markersize=10)

    plot_nols, = ax[1, i].plot(
        (all_trace_nols[i] - fmin) / scale,
        lw=4, marker='h', markevery=100,
        markersize=10)

    plot_pdhg, = ax[1, i].plot(
        (all_trace_pdhg[i] - fmin) / scale,
        lw=4, marker='^', markevery=100,
        markersize=10)

    plot_pdhg_nols, = ax[1, i].plot(
        (all_trace_pdhg_nols[i] - fmin) / scale,
        lw=4, marker='d', markevery=100,
        markersize=10)

    ax[1, i].set_xlabel('Iterations')
    ax[1, i].set_yscale('log')
    ax[1, i].set_ylim((1e-14, None))
    ax[1, i].grid(True)


plt.gcf().subplots_adjust(bottom=0.15)
plt.figlegend(
    (plot_tos, plot_nols, plot_pdhg, plot_pdhg_nols),
    ('TOS with line search', 'TOS without line search', 'PDHG LS', 'PDHG no LS'), ncol=5,
    scatterpoints=1,
    loc=(-0.00, -0.0), frameon=False,
    bbox_to_anchor=[0.05, 0.01])

ax[1, 0].set_ylabel('Objective minus optimum')
plt.show()
Total running time of the script: ( 8 minutes 40.017 seconds)
