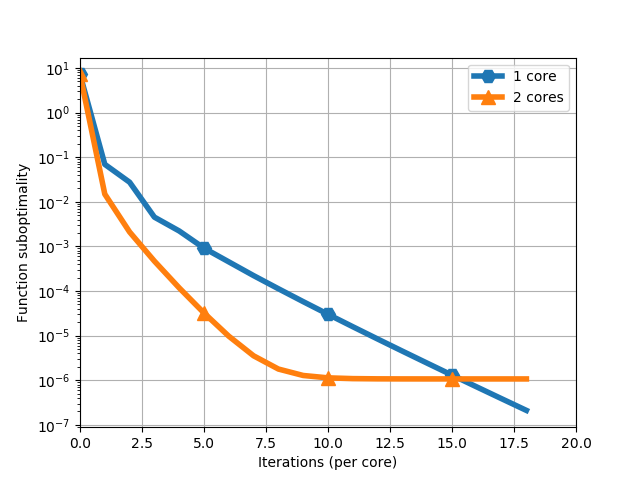
Asynchronous Stochastic Gradient
Comparison of asynchronous SAGA (ASAGA) for different number of cores.
Out:
Loading data ...
RCV1 dataset is not present in data folder. Downloading it ...
Finished downloading
Running with 1 core ...
Running with 2 cores ...
import numpy as np
import pylab as plt
import copt as cp

print('Loading data ...')
X, y = cp.datasets.load_rcv1()

# .. use a logistic loss with L1 + L2 (aka elastic-net) penalty ..
f = cp.LogisticLoss(X, y, 1.0 / X.shape[0])
g = cp.L1Norm(1e-6)

print('Running with 1 core ...')
opt_1cores = cp.minimize_SAGA(f, trace=True, max_iter=20)

print('Running with 2 cores ...')
opt_2cores = cp.minimize_SAGA(f, trace=True, n_jobs=2, max_iter=20)

# .. plot result ..
fmin = 0.0844502390843
plt.plot((opt_1cores.trace_func - fmin) / fmin, lw=4, marker='H',
         markersize=10, markevery=5, label='1 core')
plt.plot((opt_2cores.trace_func - fmin) / fmin, lw=4, marker='^',
         markersize=10, markevery=5, label='2 cores')
plt.yscale('log')
plt.ylabel('Function suboptimality')
plt.xlabel('Iterations (per core)')
plt.xlim((0, 20))
# plt.ylim(ymin=1e-10)
plt.grid()
plt.legend()
plt.show()
Total running time of the script: ( 4 minutes 0.478 seconds)
